Find Your Top Pages in Google Analytics
Find your top pages in Google Analytics easily with this quick guide.
Google Analytics provides tremendous insight about your website visitors and content. One area of Google Analytics that I check constantly is my most popular content and pages. And, of course, you can also review your least popular content.
Understanding your most popular content can help you with your SEO strategy, content refreshes, calls to action, and much more. For your least popular content, it might also be an indication that you need to delete that content altogether, revise your page SEO, or revise the page or post to increase traffic or improve the specific goal for that content.
I’ll walk you through how to find your most popular content with SeoHighLighter and then with Google Analytics.
Finding your Top Pages in Google Analytics with SeoHighLighter
1) Login to SeoHighLighter at https://www.seohighlighter.com/customer/login.
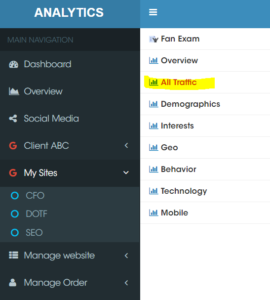
2) Find the site that you would like to check in the navigation pane on the left and click on that site, and then click on “All Traffic.”

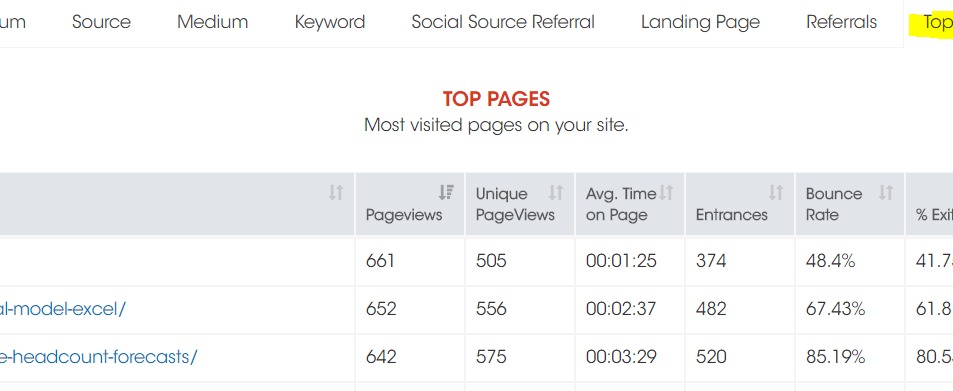
3) Scroll down slightly until you see the Traffic tabs and then click on Top Pages.

4) You will see a list of your top pages that you can sort by key metrics.
The data you can view on this page is below along with their definitions.
Pageviews – defined as a view of a page on your site that is being tracked by the Analytics tracking code. If a user clicks reload after reaching the page, this is counted as an additional pageview. If a user navigates to a different page and then returns to the original page, a second pageview is recorded as well.
Unique Pageviews – aggregates pageviews that are generated by the same user during the same session. A unique pageview represents the number of sessions during which that page was viewed one or more times.
Average Time on Page – the average amount of time users spent on a specified page or screen, or a set of pages or screens.
Entrances – is incremented on the first pageview or screen view hit of a session. In contrast, Sessions is incremented on the first hit of a session, regardless of hit type. Thus, there may be a discrepancy between Entrances and Pageviews or Screen views for properties where the first hit of a session can be an event hit.
Bounce Rate – is a single-page session on your site.
% Exit – For all pageviews to the page, Exit Rate is the percentage that were the last in the session
Page Value – is the average value for a page that a user visited before landing on the goal page or completing an Ecommerce transaction (or both). This value is intended to give you an idea of which page in your site contributed more to your site’s revenue
Finding your Most Popular Content with Google Analytics
1) Login to your Google Analytics account.
2) On the left navigation pane, click on Behavior -> Site Content -> All Pages
3) This will serve a page with a chart and table showing your most popular content.
